
STATE OF ASIA AMERICA
community of resilience
ABOUT THE REPORT
The State of Asia America Report is AREAA's annual publication dedicated to sharing the latest and most important trends regarding homeownership in the Asian American, Native Hawaiian, and Pacific Islander (AANHPI) community. The 2025 issue focuses on the unprecedented weather events that have disrupted homeownership and even our sense of belonging.
EXECUTIVE SUMMARY
For the 2025 State of Asia America Report, we took a different, distinctly human-centered approach to capture the very personal impacts of the recent unprecedented rise in weather events, which have challenged the stability of homeownership, inventory, affordability, mortgage rates, adequate insurance coverage, and even our sense of what it means to belong to a place.
Through powerful individual stories, we illuminate both the emotional and economic toll these disasters imposed on AANHPI families and their communities as they navigate loss and recovery. Next, we explore the stark realities of rebuilding after disaster, not just how, but whether homeowners can rebuild at all.
Detailed, disaggregated data continues to be an important role in this report. We’ve mapped disasters from the past 10 years, highlighting areas where AREAA can best focus our efforts, and included analysis of significant AANHPI migration trends across the country.
We also explore how the new administration’s shifting federal policies ranging from proposed changes to HUD staffing and GSE reform, to tariffs and construction labor shortages—pose both risks and opportunities for AANHPI homeownership, with the potential to either ease or exacerbate affordability and access, particularly in support of multigenerational and first-time homebuyers.
This 10th edition of the State of Asia America Report makes clear that AREAA continues to evolve alongside the communities we support. Throughout this journey, our commitment remains steadfast: advocate fiercely, respond swiftly, and support sustainably—for every AANHPI family.

SECTION 1:
CRISIS AND COMMUNITY - NAVIGATING DISASTERS

SECTION 2:
REBUILD AND RECLAIM - THE PATH TO RECOVER

SECTION 3:
VISION FOR TOMORROW - ADAPTING TO A CHANGING TOMORROW
CRISIS AND COMMUNITY - NAVIGATING DISASTERS
“ The American Dream isn’t immune to fire, flood, or storm—and neither are the communities who embody it.”
— 2025 SAA Report, Section 1, page 6

EATON AND PALISADES FIRES
In Los Angeles, hundreds without families to house them or the financial stability to cover short or long-term housing remain in shelters with few affordable alternatives. Reports of widespread price gouging in rental housing reveal rates spiking far beyond legal limits, despite a citywide moratorium on the practice.

HURRICANE HELENE
In North Carolina, months after Hurricane Helene struck in late September 2024, some 12,000 people remain displaced, with many relying on FEMA-funded hotel stays or temporary RV housing after losing homes in mountainous areas where flood insurance was uncommon.
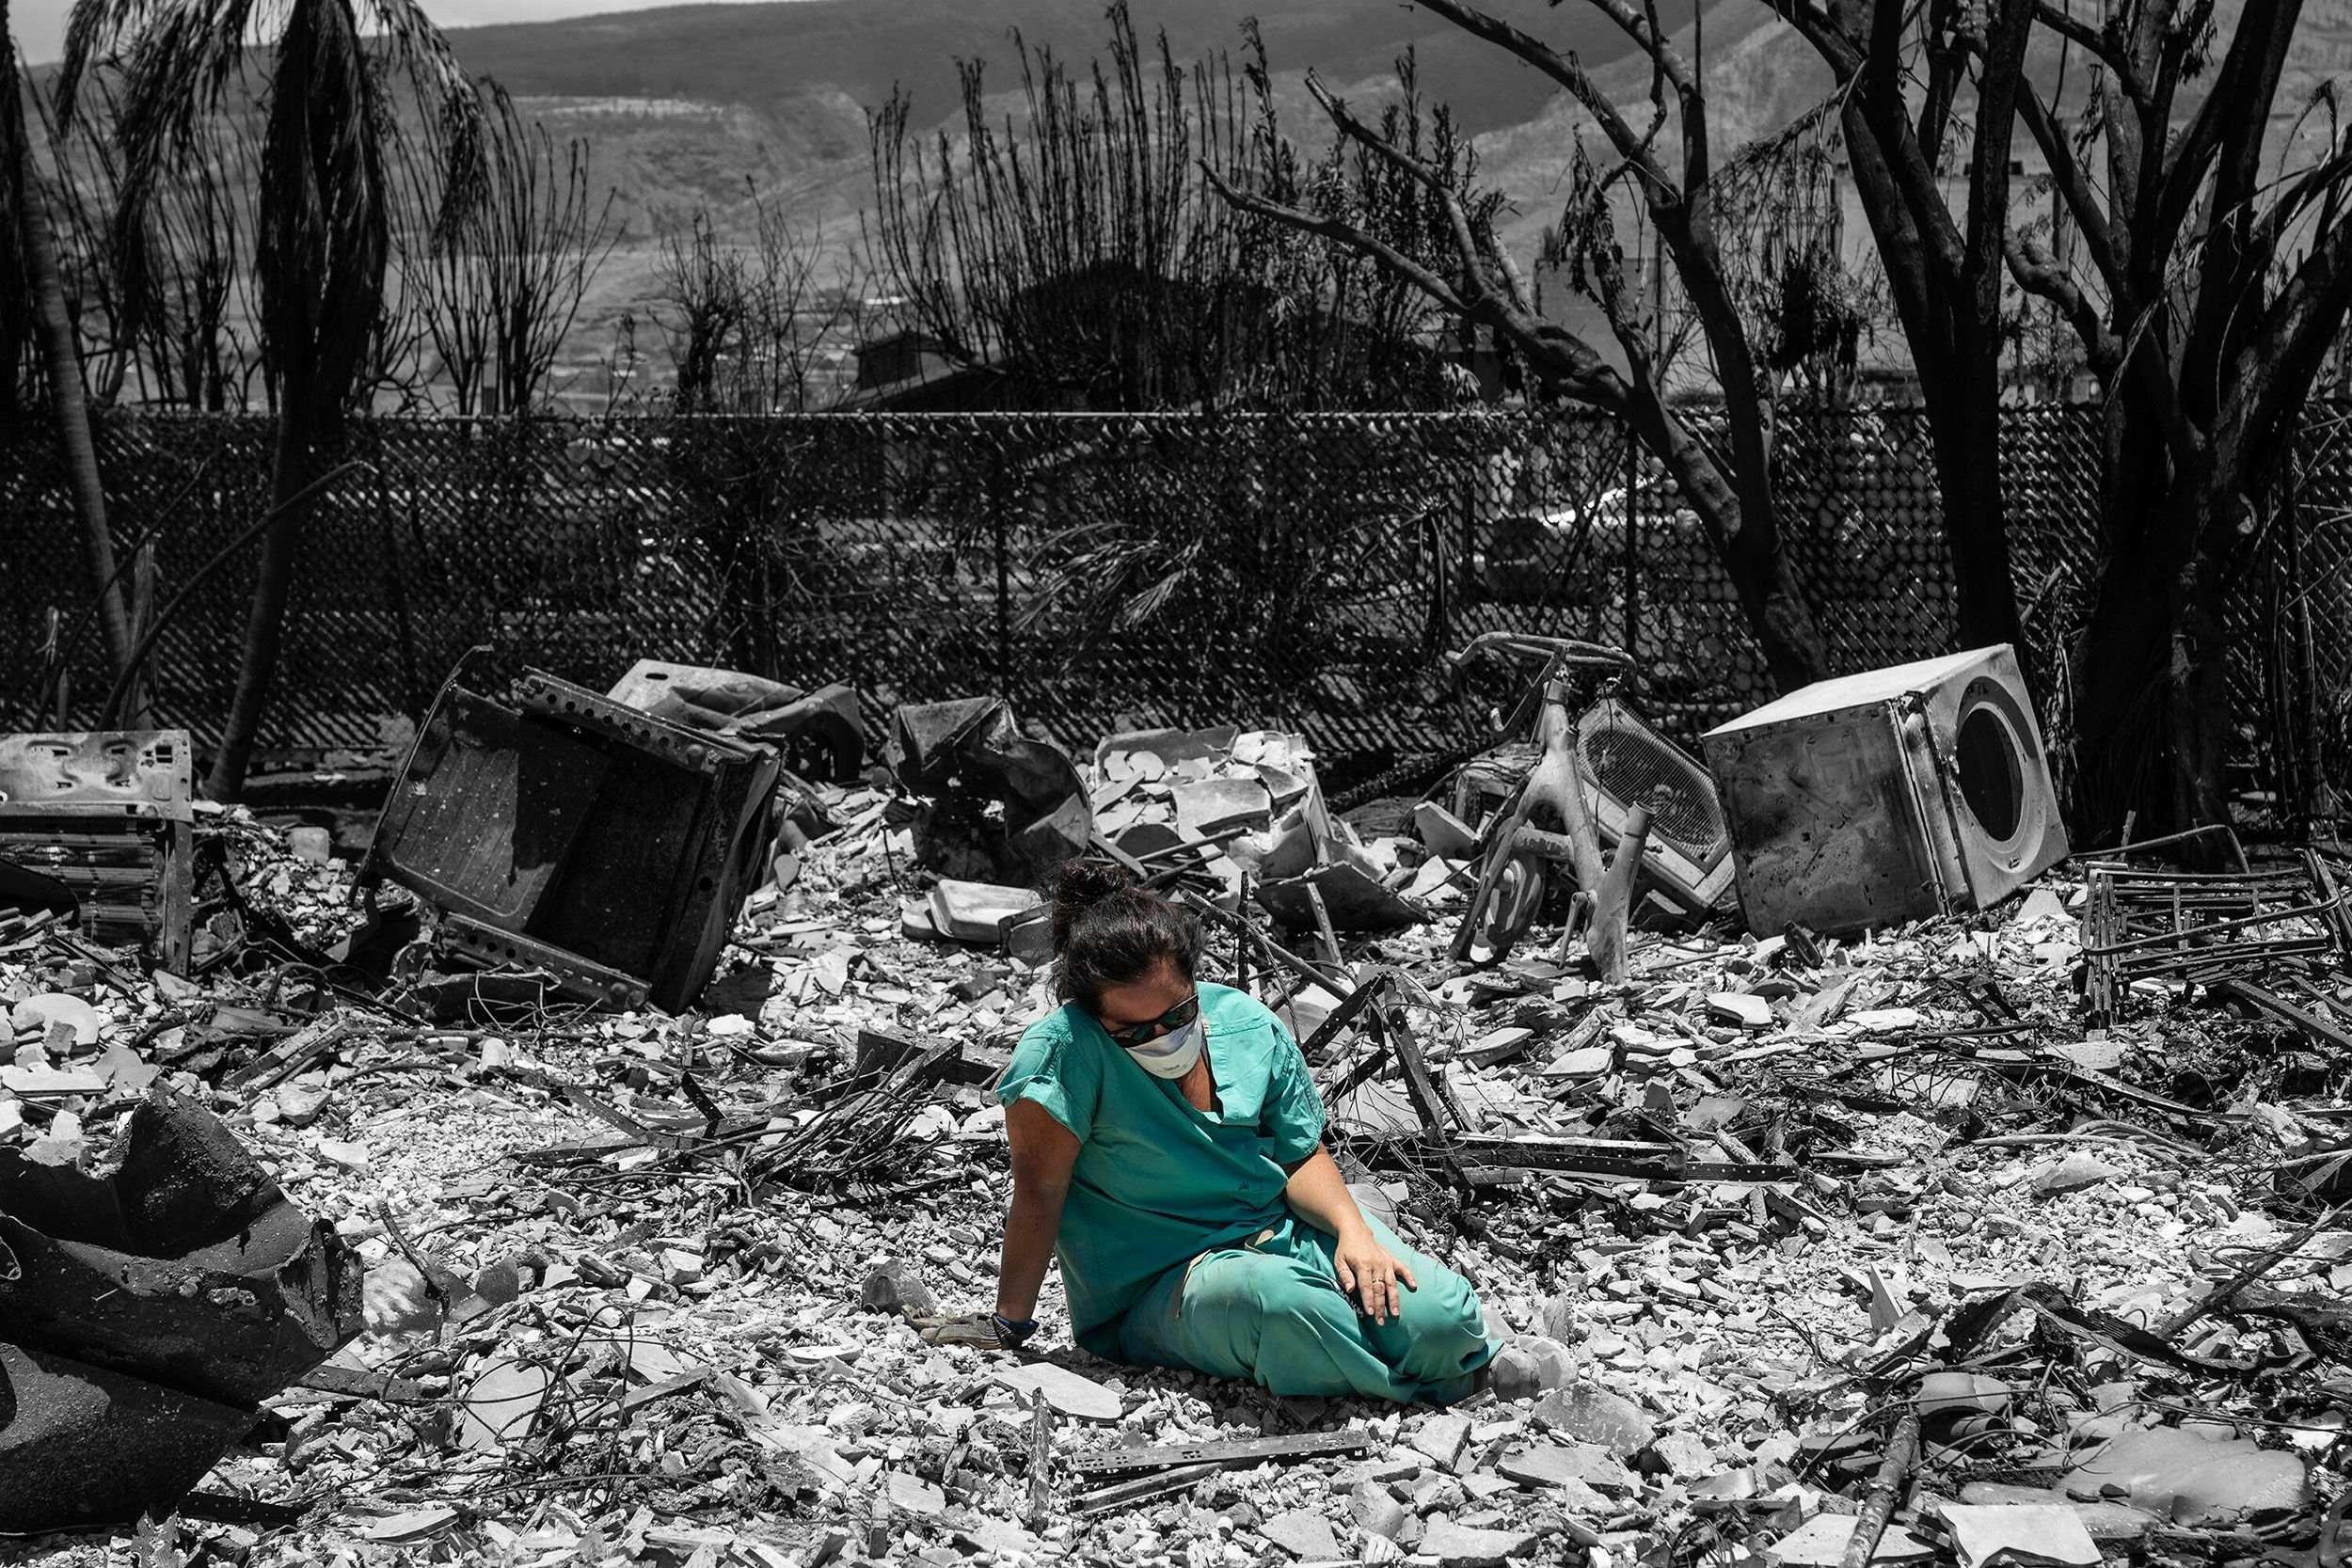
MAUI WILDFIRES
In Maui, nearly two years after the fires, many former homeowners remain in limbo, unable to return and struggling to secure long-term housing. Cultural beliefs about sacred land make rebuilding a delicate challenge, yet communities persist in honoring their ancestors while forging a future.
REBUILD AND RECLAIM - THE PATH TO RECOVER
“Disaster recovery has always been slow, but in an era of escalating climate disasters, the scale of destruction is outpacing the systems meant to help survivors recover.”
— 2025 SAA Report, Section 2, page 23


JOAN NGUYEN’S INITIATIVE
Following the 2025 Eaton fires in LA, Joan Nguyen launched the LA Family Support Initiative, offering three days of free childcare to families who had lost their homes. “We wanted to give the kids some semblance of normalcy, where they could, you know, maybe every few days be with their friends through a camp or through one of our providers.”

REBUILDING IN LAHAINA
For Native Hawaiians, land (‘āina) is sacred, embodying ancestral connections and spiritual significance. This perspective shapes Lahaina’s recovery, where many burned areas are considered wahi pana—sacred places requiring cultural consultation before reconstruction. Sites where lives were lost are kapu (sacred or forbidden), meaning ceremonies must be held to honor the deceased before rebuilding begins. Just days after the fire, cultural practitioners led a 10-day vigil, guided by the Hawaiian moon calendar, to prepare the land for healing.

WHAT AFFECTS THE COST TO REBUILD?
Square footage: The larger the home, the more expensive it will be to rebuild, as more square footage means more materials and labor.
Location: Building costs can vary significantly depending on the location. Areas with high labor and material costs will result in higher rebuild costs.
Building materials: The type and quality of building materials used can significantly impact the rebuild cost. High-end materials will naturally cost more.
Labor costs: The cost of hiring contractors and laborers to rebuild a home can vary depending on the location and availability of skilled workers. In areas with a labor shortage, costs can be significantly higher.
AREAA FOUNDATION
In 2011, the AREAA Foundation was founded when a tsunami hit the northern shores of Japan and devastated the homes of millions of Japanese. Since then, the AREAA Foundation has been able to mobilize funding to make a difference in the lives of those affected by natural disasters. The victims and communities that the Foundation has helped and will continue to help are the beating heart of its mission. Today, the AREAA Foundation stands ready to provide emergency financial assistance to communities in need.
Click the button below to learn more about the AREAA Foundation, or donate to one of their several initiatives benefitting the LA Wildfires, AANHPI Homebuyers, and more.
VISION FOR TOMORROW - ADAPTING TO A CHANGING TOMORROW
“AREAA remains committed to ensuring homeownership remains a path to stability, security, and generational wealth for AANHPI families.”
— 2025 SAA Report, Section 3, page 39


THE FUTURE OF SUSTAINABLE HOMEOWNERSHIP
In Los Angeles, hundreds without families to house them or the financial stability to cover short or long-term housing remain in shelters with few affordable alternatives. Reports of widespread price gouging in rental housing reveal rates spiking far beyond legal limits, despite a citywide moratorium on the practice.

OPPORTUNITIES IN UNCERTAINTY
While policy shifts under the Trump administration create uncertainty, some changes could benefit AANHPI homebuyers—if they lower costs rather than add new barriers. AREAA is tracking these developments to ensure that efforts to expand homeownership don’t inadvertently make it more difficult to achieve. AREAA's 3 Point Plan details three key initiatives; GSE Restructuring, Tax Reform, and Housing Affordability.

THE NEED FOR DISAGGREGATED DATA
While policy shifts under the Trump administration create uncertainty, some changes could benefit AANHPI homebuyers—if they lower costs rather than add new barriers. AREAA is tracking these developments to ensure that efforts to expand homeownership don’t inadvertently make it more difficult to achieve. AREAA's 3 Point Plan details three key initiatives; GSE Restructuring, Tax Reform, and Housing Affordability.
A MESSAGE FROM OUR SPONSOR, RE/MAX
RE/MAX has been a proud supporter of AREAA for many years – in part because both organizations are very much aligned in supporting homeownership opportunities for all. We’re also proud to sponsor the State of Asia America Report, because it’s the most comprehensive compilation of Asian American and Pacific Islander real estate, demographic and economic data available today. The insights in the report can help real estate agents elevate their knowledge and level of service, leading to an even better experience for their buyers and sellers.
- Abby Lee,
RE/MAX Executive Vice President Marketing,
Communications, and Events